Student enrollment in a district is a core driver of the cost of delivering education, and is a core component in how some school funding, like state aid, is delivered. Across New Jersey, there have been several examples of districts that have seen declining enrollments. Most notably, our northern neighbor Middletown recently announced a provisional plan to close two elementary schools largely due to declining enrollments and increasing costs. Years of declining student counts in neighboring Rumson and Little Silver has also been noted as the primary factor behind their much higher observed spending-per-pupil than districts like Fair Haven.
To better understand these trends, I turn to some data on district enrollments from the NJ Department of Education. Details on the data source used can be found here. The specific questions addressed in this document include:
What have enrollment trends looked like in Fair Haven over the past decade?
How have total enrollments in Fair Haven compared to peninsula districts?
How have total enrollments in Fair Haven compared to other similar districts?
Note
This document is not meant to be an academic analysis of enrollment patterns. Rather, I wrote it to assist my own understanding of some of the issues and circumstances that impact Fair Haven schools, and as a way to understand one aspect of Fair Haven’s experience relative to peers.
Code - Load libraries
options(width =120)library(tidyverse)library(cluster)library(MASS)library(ggpmisc)library(ggrepel)library(glue)library(DT)library(factoextra)library(gt)library(purrr)set.seed(2024)# Commonly used State ID numbers (staid) and Federal Local Education Authority (LEA) IDs# for FH, Little Silver, Rumson, and Shrewsburyfh_leaid <-"3404950"fh_staid <-"NJ-251440"ls_leaid <-"3408790"ls_staid <-"NJ-252720"rums_leaid <-"3414370"rums_staid <-"NJ-254570"shrews_leaid <-"3414970"shrews_staid <-"NJ-254770"district_name_colors <-c("Fair Haven Boro"="#4169E1","Little Silver Boro"="#1F2868","Rumson Boro"="#8640C4","Shrewsbury Boro"="#004500","Other"="darkgrey")district_stleaid_colors <-c("#4169E1", "#1F2868", "#8640C4", "#004500", "lightgrey")names(district_stleaid_colors) <-c(fh_staid, ls_staid, rums_staid, shrews_staid, "Other")knitr::opts_chunk$set(fig.width =8, fig.height =10,fig.align ="center")
Code - Load enrollment data
comb2324 <-read_csv("datasets/comb2324.csv")enr_all <-read_csv("datasets/enr_all.csv")# Attach peer set to enrollment data setenr_all$hc_euclid_ward <- enr_all$ST_LEAID %in% comb2324$ST_LEAID[comb2324$hc_euclid_ward]# Set up colorsenr_all <- enr_all %>% dplyr::mutate(dist_colors =case_when( ST_LEAID %in%names(district_stleaid_colors) ~ ST_LEAID,TRUE~"Other" ))
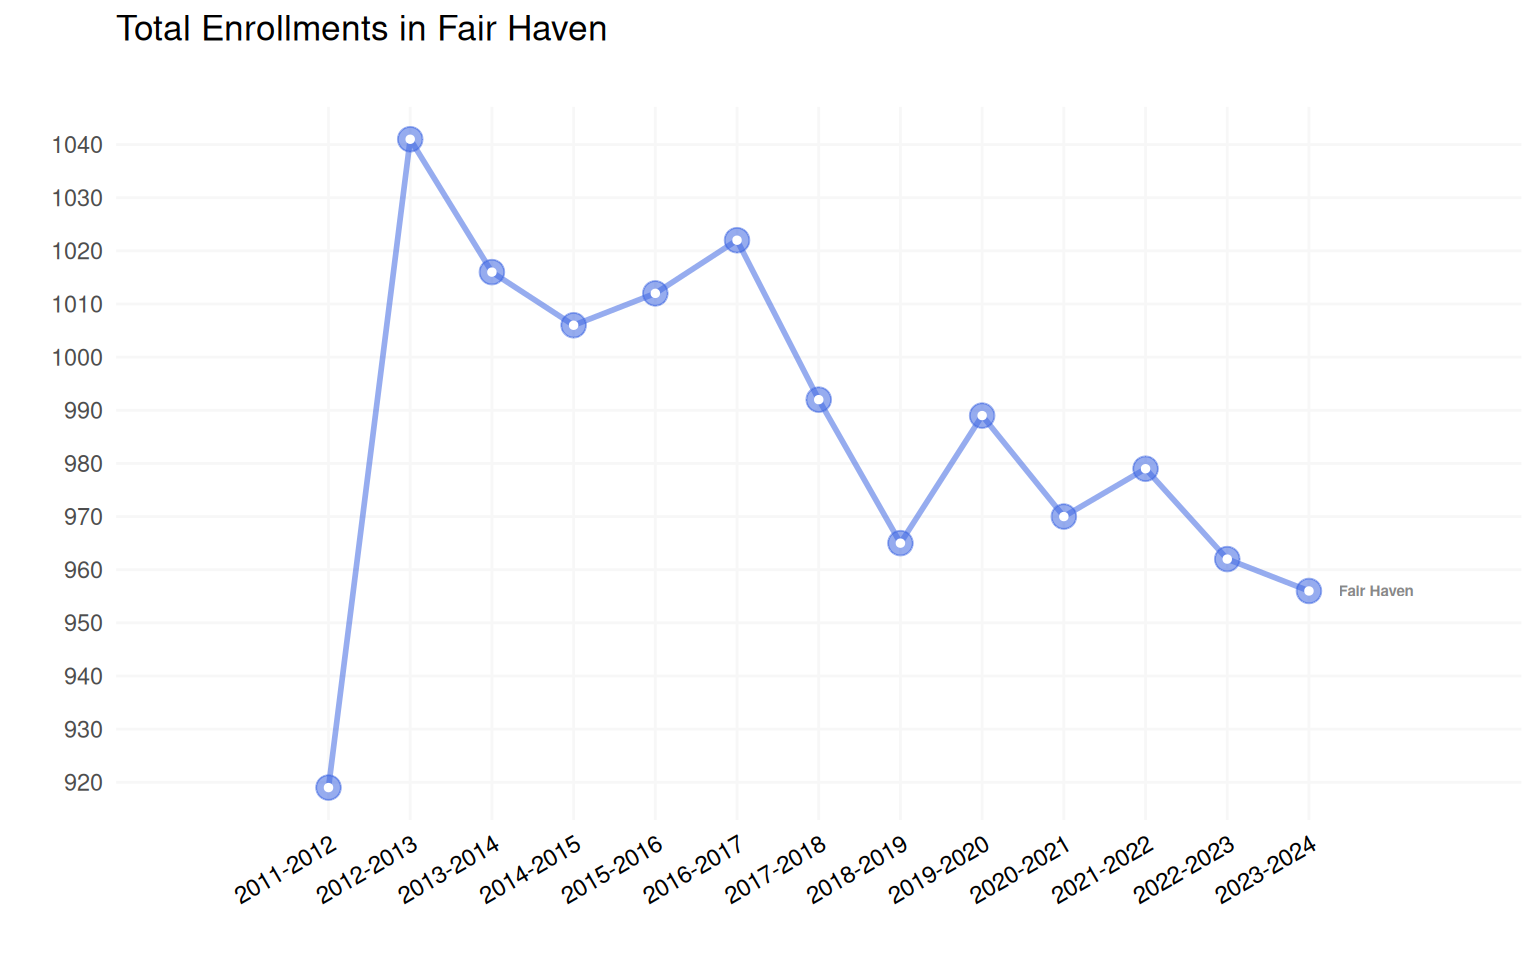
As seen in Figure 1, Fair Haven has seen a general decline in total enrollments since the 2012-13 school year, from 1041 students to 956 students in 2023-24. In the last 10 years, Fair Haven has seen an overall decline of 5.9%.
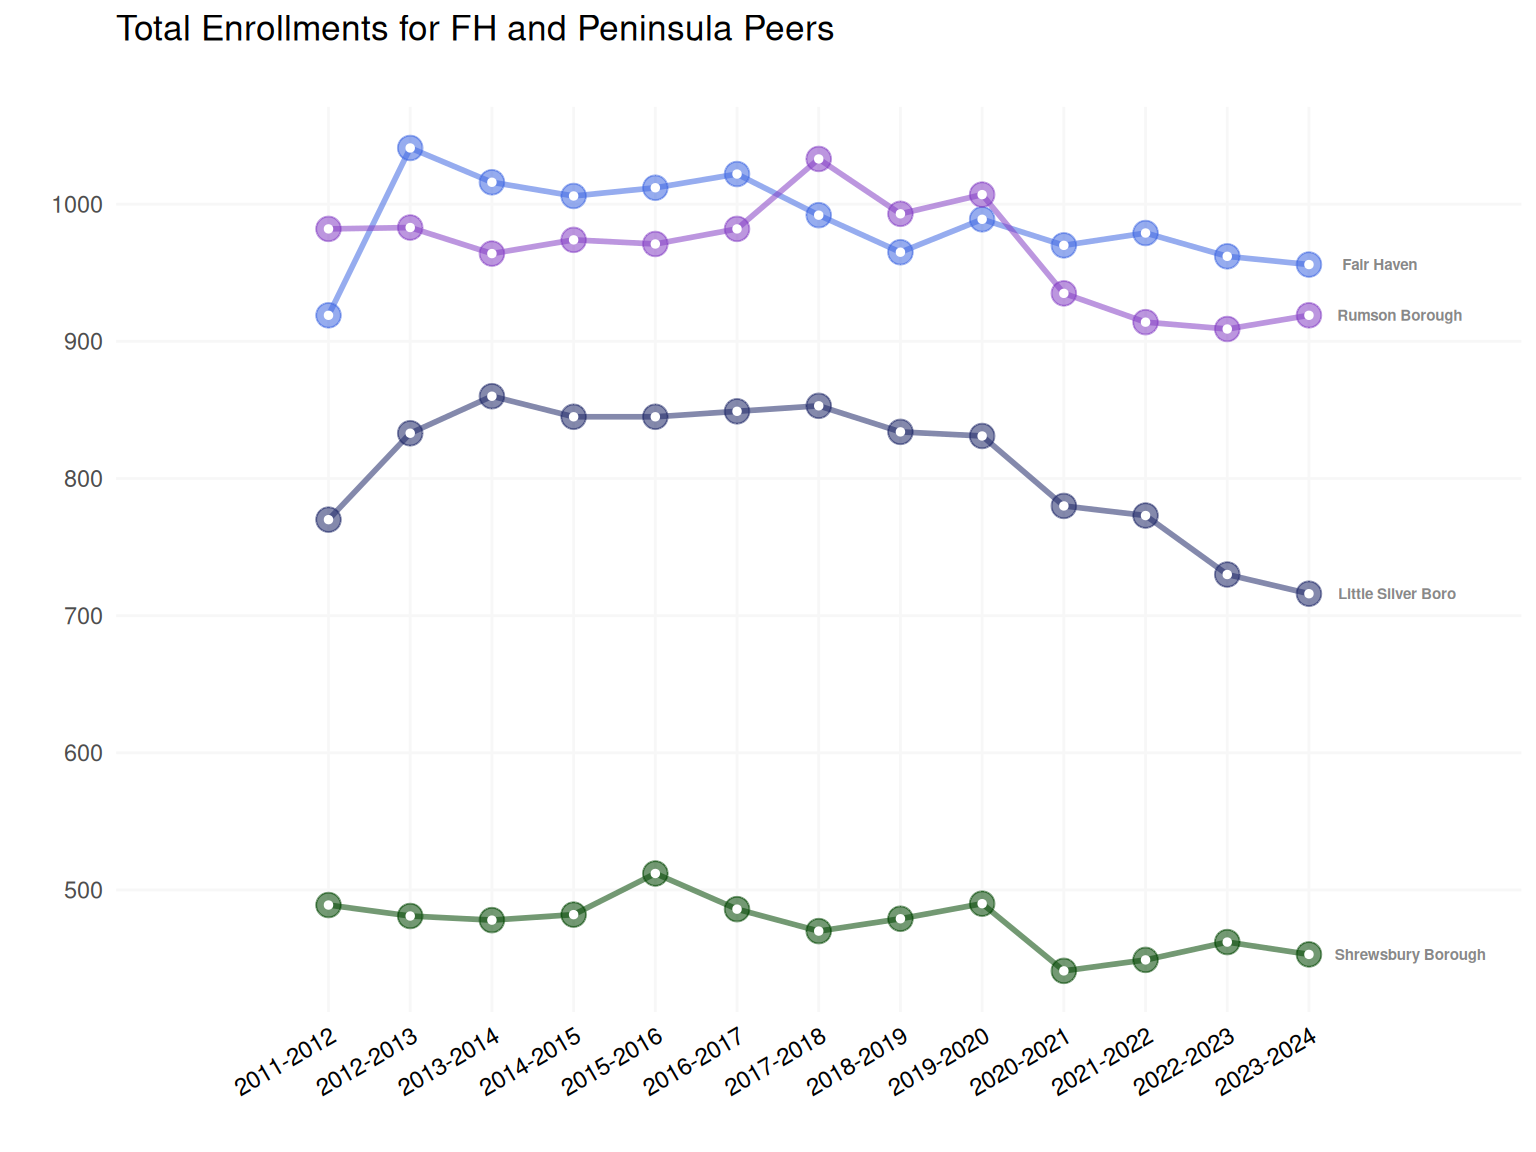
Fair Haven and Peninsula Peers
Figure 2 adds the Peninsula peers, and as the axes change, it becomes visually apparent that the decline in the number of Fair Haven students is not as large as declines seen in neighboring Rumson, Little Silver, and Shrewsbury, all of whom saw step-change declines during the Covid years of 2019-20 to 2020-21.
Figure 2: District Enrollments for Fair Haven and Peninsula
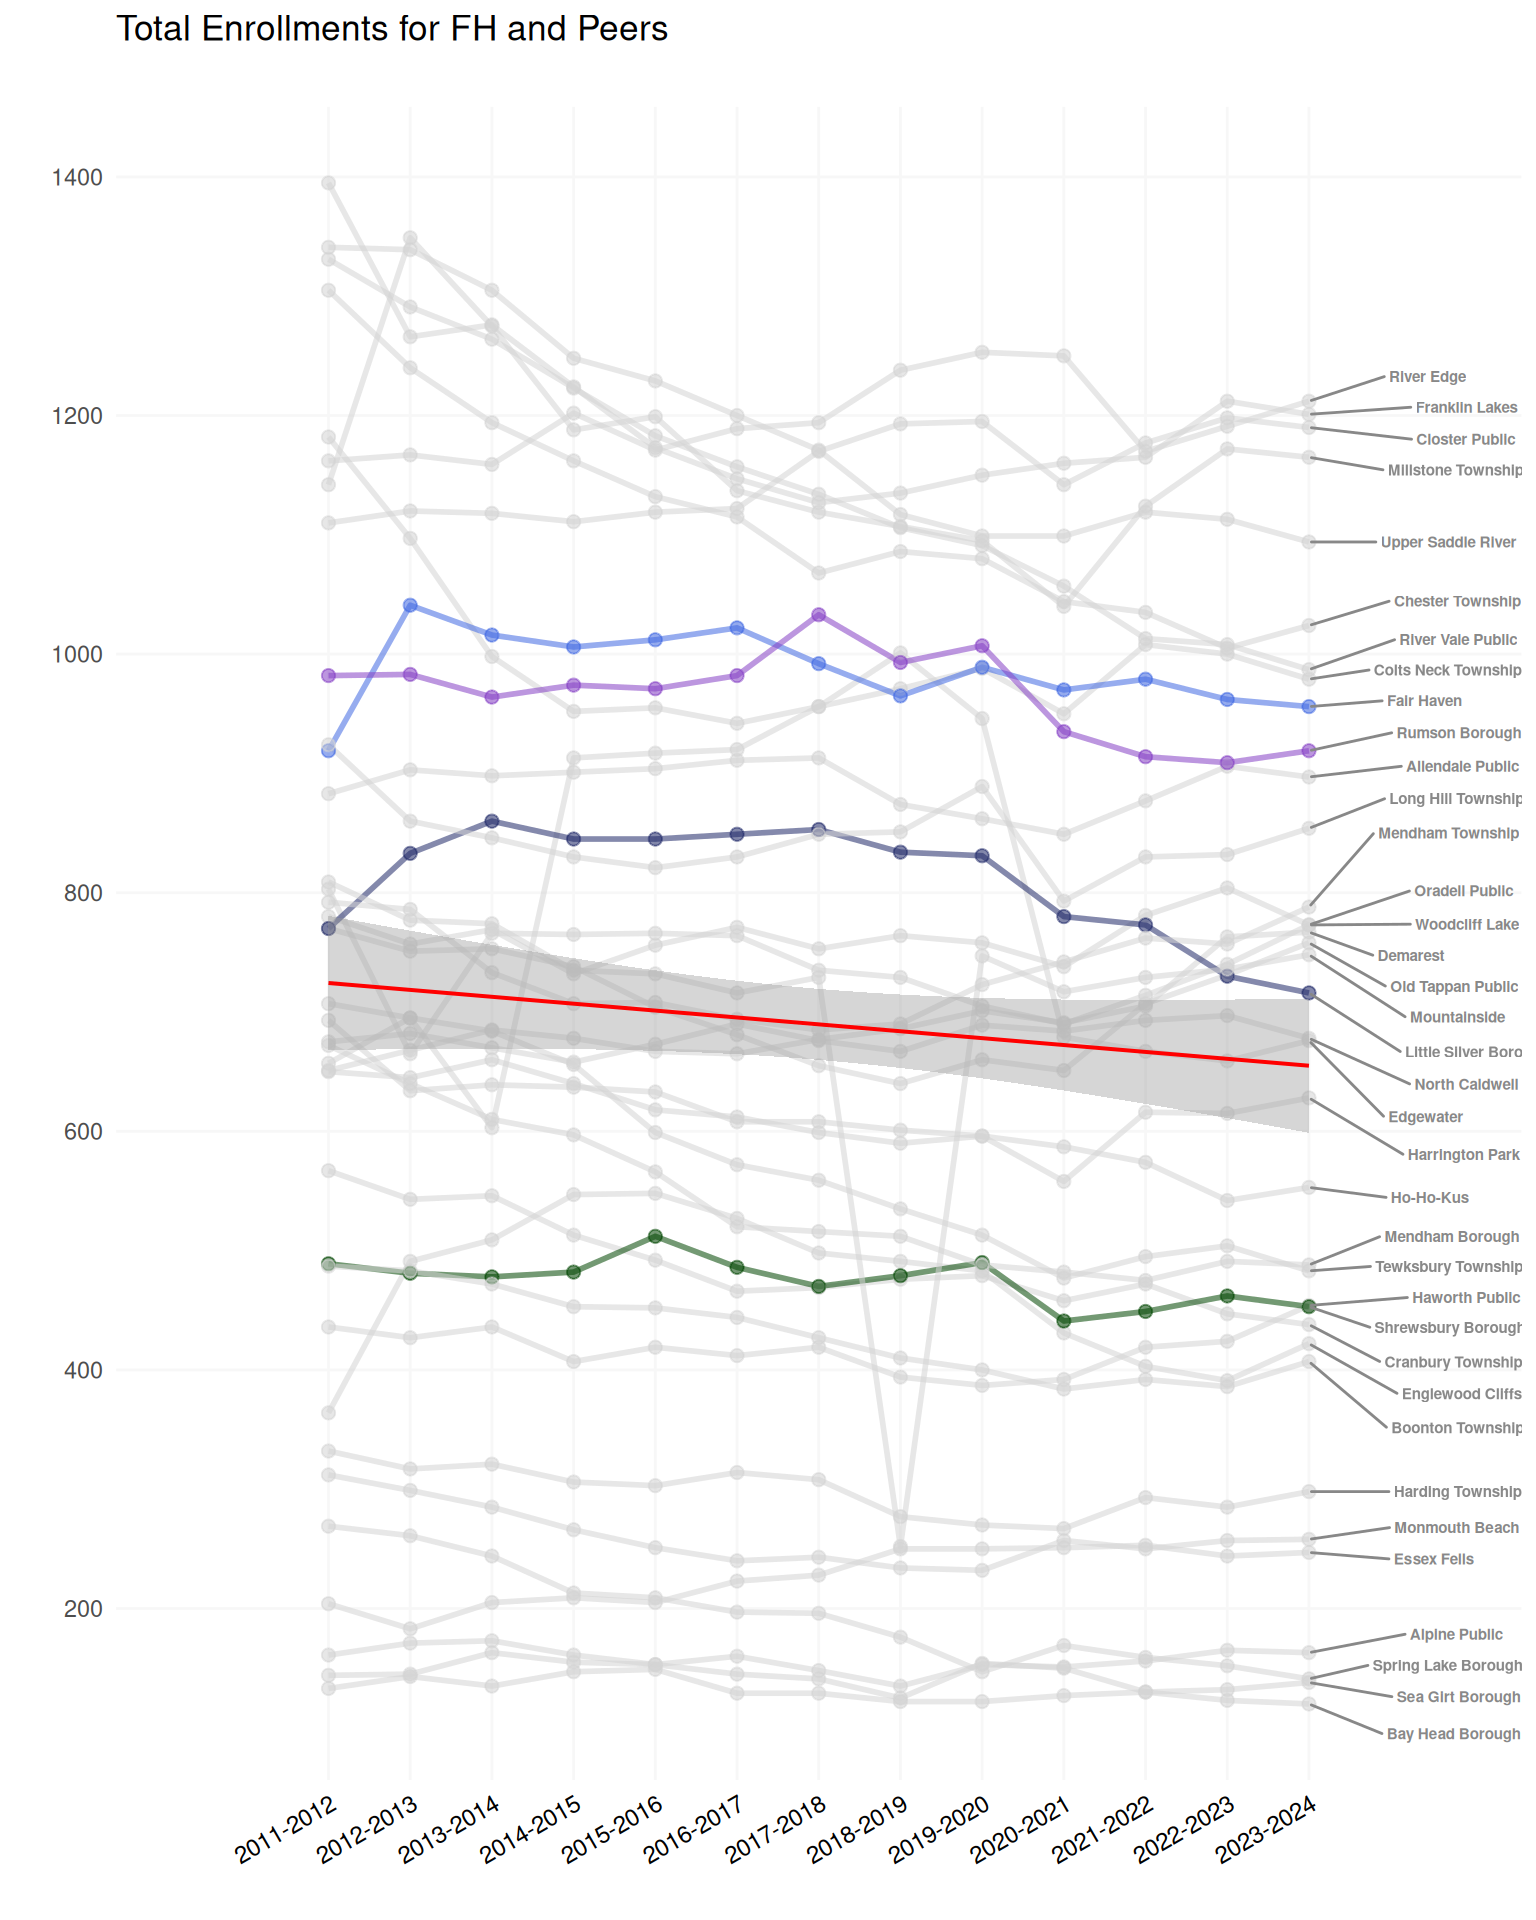
Fair Haven and Peers
To be sure, Figure 3 shows Fair Haven and the other 36 peers in our peer set. The red line sloping downwards suggests a general trend of declining enrollments over time over the time period.
Code - Enrollment trends for Fair Haven and Peers
enr_all %>% dplyr::filter(hc_euclid_ward, TotalEnrollment <1500) %>% {ggplot(data=., aes(x=SchoolYear, y=TotalEnrollment, group=ST_LEAID, color=dist_colors)) +geom_line(aes(alpha =1), linewidth =1) +geom_point(aes(alpha =1), size =2) +scale_x_discrete(expand =c(.2, .2), labels =sort(unique(.$SchoolYear))) +scale_y_continuous(n.breaks =10) +geom_smooth(aes(group=NA), method="lm", color="red", linewidth=.7) +geom_text_repel(data = . %>%filter(SchoolYear =="2023-2024"),aes(label =gsub(" School District", "", DistrictName), x =13) , hjust =-1, fontface ="bold", color ="#888888", size =2,direction ="y",ylim =c(-Inf, Inf), # Allow movement in the entire vertical range#xlim = c(NA, NA) ) +labs(x ="", y ="", title ="Total Enrollments for FH and Peers", subtitle ="") +theme_minimal() +theme(axis.text.x =element_text(size=9, vjust=1, hjust=1, color ="black", angle =30)) +scale_color_manual(values=district_stleaid_colors, guide="none") +scale_alpha(guide="none") +theme(panel.grid.major.y =element_line(color="grey97")) +theme(panel.grid.minor.y =element_blank()) +theme(panel.grid.major.x =element_line(color="grey97")) +theme(panel.grid.minor.x =element_blank()) }
Figure 3: District Enrollments for Fair Haven and Peers
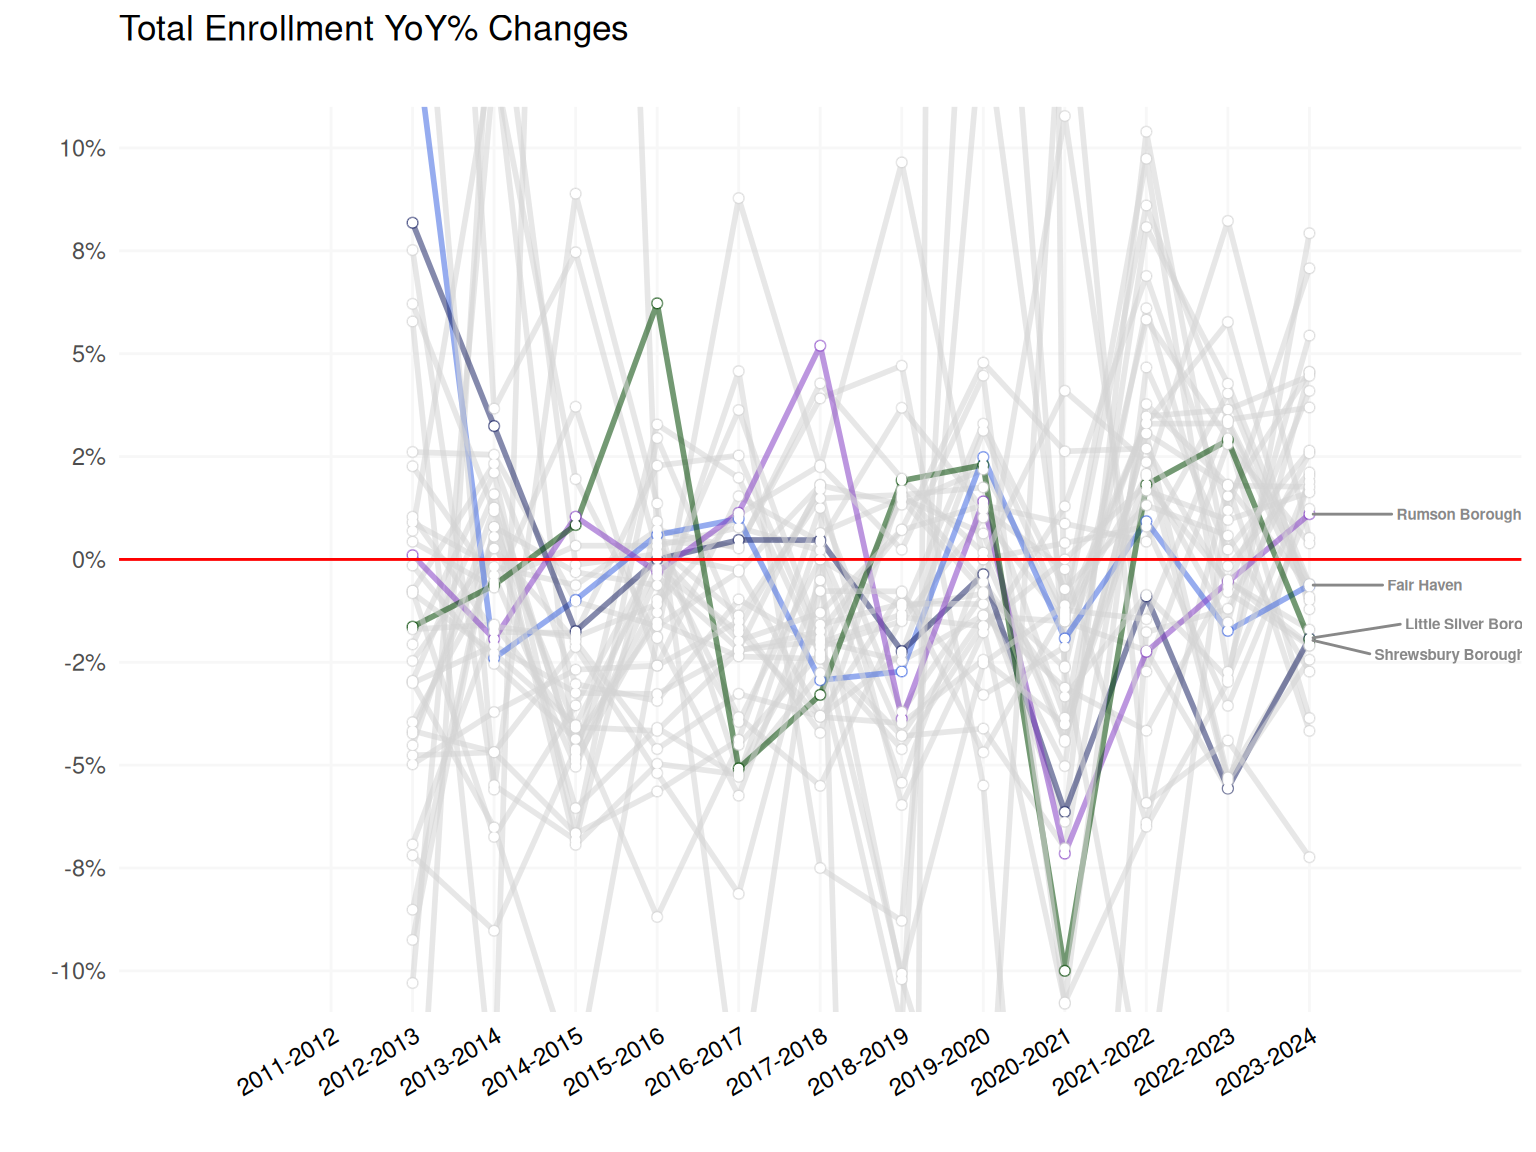
Another way to look at this is through year-over-year changes in enrollment. Figure 4 shows the percent change from year to year for Fair Haven and peers. The dip in 2020-21 becomes more exaggerated here. Also of note is how Fair Haven, compared to peers, has generally seen less extreme changes from year to year.
Figure 4: District Enrollment Deltas for FH and Peers
Finally, it is worth noting that there are some districts that have grown in the past ten years and others that have shrunk. For example, Table 1 shows that between 2013-14 and 2023-24, districts such as Spring Lake and Tewksbury have contracted 42% and 29%, respectively. Essex Fells and Edgewater have grown by 21% and 12%, respectively.
Code - 10-year District Enrollment Change
tenyear <- enr_all %>% dplyr::filter(hc_euclid_ward, TotalEnrollment <1500) %>%pivot_wider(names_from ="SchoolYear", values_from ="TotalEnrollment", id_cols ="ST_LEAID") %>% dplyr::mutate(Change =`2023-2024`/`2013-2014`-1) %>% dplyr::arrange(Change) %>% dplyr::select(ST_LEAID, `2023-2024`, `2013-2014`, Change)tenyear$DistrictName =gsub(" School District", "", comb2324$DistrictName[match(tenyear$ST_LEAID, comb2324$ST_LEAID)])tenyear %>% dplyr::select(DistrictName, `2023-2024`, `2013-2014`, Change) %>%gt() %>%fmt_percent(columns = Change,decimals =1 ) %>%tab_header(title ="Enrollment Changes from 2013-14 to 2023-24",subtitle ="Fair Haven and Peers" ) %>%tab_source_note("Data from NJ Dept of Education.") %>%opt_interactive(page_size_default =5)
Table 1
Enrollment Changes from 2013-14 to 2023-24
Fair Haven and Peers
Data from NJ Dept of Education.
Conclusion
The goal of this short document was to surface some data on enrollment trends in Fair Haven and peers. It is clear that, although enrollment have generally been declining in Fair Haven, the district did not see the sharper permanent declines as Peninsula Peers saw during the Covid. In addition, Fair Haven is neither rapidly growing nor shrinking like other peer districts.